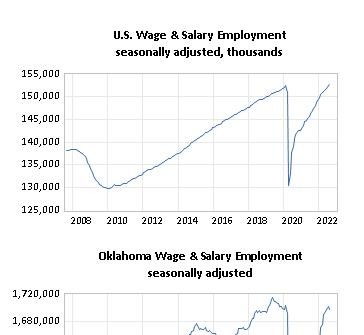
Oklahoma's post-pandemic recovery has been disappointingly slow relative to the nation. The state and both major metro areas have lagged well behind the U.S. in…
Pic-of-the-Week: 2 out of 3 New Jobs in Recovery Filled by Workers 55+ (10/27/2014)
Workers 55 and Over Comprise the Most Vibrant Sector of the U.S. Workforce. Been wondering who has filled the more than 8 million new jobs created since the job recovery began in January 2010? Well, as shown in our pic-of-the-week, two out of three have gone to workers 55 and over. Since the national job recovery began in January 2010, these workers have filled 5.2 million of the 8.15 million net new jobs added in the period.
These workers have far outpaced all other age cohorts and have done it consistently for the past two decades. Workers in the second place 25 to 34 age group have added 2 million in the recovery but remain in a slow downtrend underway since 1990. The relatively small 20 to 24 age group has done remarkably well, adding 1.3 million workers, but remains at roughly the same average level since 1980.

It is the core adult workforce between the ages of 35 and 54 that has received few new jobs in the recovery. The number of workers ages 35 to 44 has increased by only 324,000, while the number of workers 45 to 54 has declined by 800,000.
Jobs Added in Recovery (since Jan-2010) by Age Group |
||
| Age Group | Jobs | Share of Total |
| 16 to 19 | 72,000 | 0.9% |
| 20 to 24 | 1,344,000 | 16.5% |
| 25 to 34 | 2,004,000 | 24.6% |
| 35 to 44 | 324,000 | 4.0% |
| 45 to 54 | -800,000 | -9.8% |
| 55 and over | 5,206,000 | 63.9% |
| Total | 8,150,000 | 100.0% |
Apparently experience still matters in the U.S. workforce!
Sign up to receive RegionTrack’s PIC OF THE WEEK!
[email_link]
Related Posts