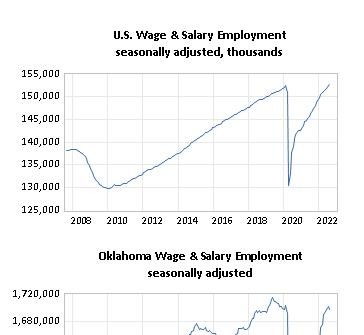
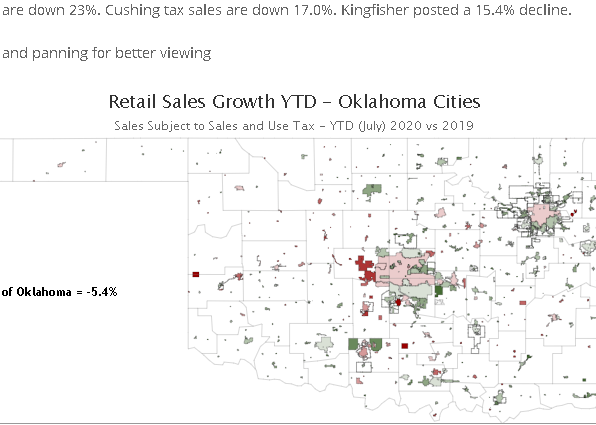
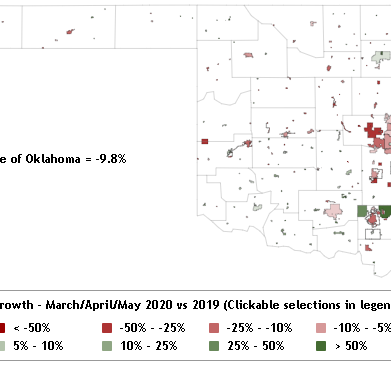
Oklahoma's post-pandemic recovery has been disappointingly slow relative to the nation. The state and both major metro areas have lagged well behind the U.S. in…
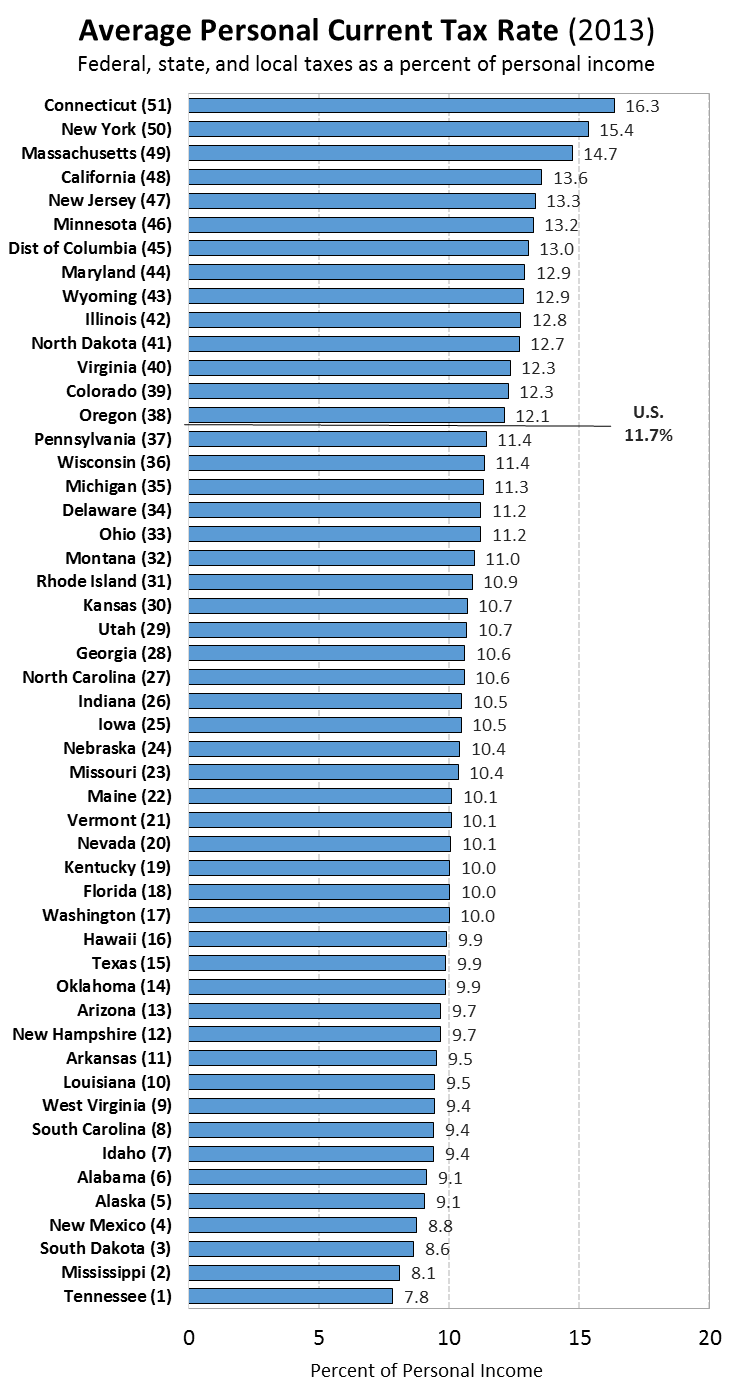
Pic-of-the-Week: Which States Pay the Highest Taxes? (11/10/2014)
Taxes are Lowest in TN, Twice as High in CT. Yes, your overall tax bill is still sensitive to where you live. The average share of personal income paid in current Federal, state, and local taxes ranges from a low of 7.8% in state-tax-free Tennessee to a high of 16.3% in Connecticut.
These two states pretty much typify the overall U.S. pattern. As shown in our pic-of-the-week, most of the lowest tax states are in the Deep South and Southwest regions. The highest tax states are in the Northeast, the West Coast, and the Rust Belt.
While the overall U.S. average is 11.7%, the median among the states is only 10.5%. This suggests that a few large states are pulling up the overall U.S. rate.
Note that the measure of “personal current taxes” used is based on the Bureau of Economic Analysis (BEA) definition. It is not a measure of “total taxes.” For a full definition, see: http://www.bea.gov/regional/definitions/
Tax rates are generally progressive, so the highest-rate states are often those with the highest income levels. This is true for Connecticut (51st), New York (50th), Massachusetts (49th), and New Jersey (47th), but it is definitely not the case for California (48th).
Some surprising states? Florida, with no state income tax, pays the 18th highest average tax rate. Hawaii, with its high overall cost of living, has only the 16th highest average tax rate. New Hampshire (12th) really does “Live Free or Die” relative to the other New England states, with only a 9.7% average tax rate.
My home state of Oklahoma and nearby Texas rank 14th and 15th, respectively, with a 9.9% average tax rate.
Sign up to receive RegionTrack’s PIC OF THE WEEK!
[email_link]
Related Posts