Skip to content

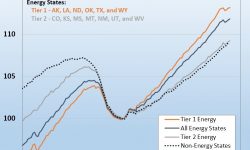
Job Growth Comes to a Halt in Key Energy States

Layoffs in the oil and gas sector are now clearly weighing on overall employment in the top-tier energy-producing states. Our pic-of-the-week illustrates the sharp slowdown in job growth in the energy states relative to the non-energy states in just the past six months.  In sharp contrast to the strong labor market conditions enjoyed in most other states, 

Read more

Pic-of-the-Week: 2 out of 3 New Jobs in Recovery Filled by Workers 55+ (10/27/2014)

Workers 55 and Over Comprise the Most Vibrant Sector of the U.S. Workforce. Been wondering who has filled the more than 8 million new jobs created since the job recovery began in January 2010? Well, as shown in our pic-of-the-week, two out of three have gone to workers 55 and over. Since the national job recovery began in January 2010, these workers have filled 5.2 million of the 8.15 million net new jobs added in the period.

Read more

Pic-of-the-Week: Nearly All New Jobs Being Created are Full-Time (09/15/2014)

NEARLY ALL NET NEW JOBS CREATED IN THE RECOVERY ARE FULL-TIME. Our pic-of-the-week highlights the differing trends in full-time and part-time job creation in the recession and recovery. The U.S. economy has added more than 8 million jobs so far in the job expansion that began in January 2010, and nearly all of the net new jobs are full-time. Part-time employment surged during the recession but has not contributed to job growth in the recovery.

Read more
Self-employment

Pic-of-the-Week: One Bright Spot for Self-Employment (08/18/2014)

SELF-EMPLOYMENT REMAINS WEAK – EXCEPT FOR THOSE INCORPORATED.  A common refrain in this recovery is that self-employment is lagging badly.  That is generally true if you look at the traditional measure of self-employment which covers unincorporated businesses (primarily sole proprietors) only. The top graph shows that the level of traditional unincorporated self-employment has been locked in a downtrend during much of the period since 2007. Currently about 9 million persons are self-employed in unincorporated businesses. 

Read more
Measures of U.S. Labor Force Utilization

Pic-of-the-Week: Watch the Employment-Population Ratio, Not the Labor Force Participation Rate (07/28/2014)

BOTTOM IN THE EMPLOYMENT-POPULATION RATIO IS ENCOURAGING.  Way too much attention is paid to the labor force participation rate.  It is the most commonly used measure of the level of involvement of the population in the labor force, but it is not the measure that contains the most information.  That honor belongs to the employment-population ratio. 

Read more
Back To Top