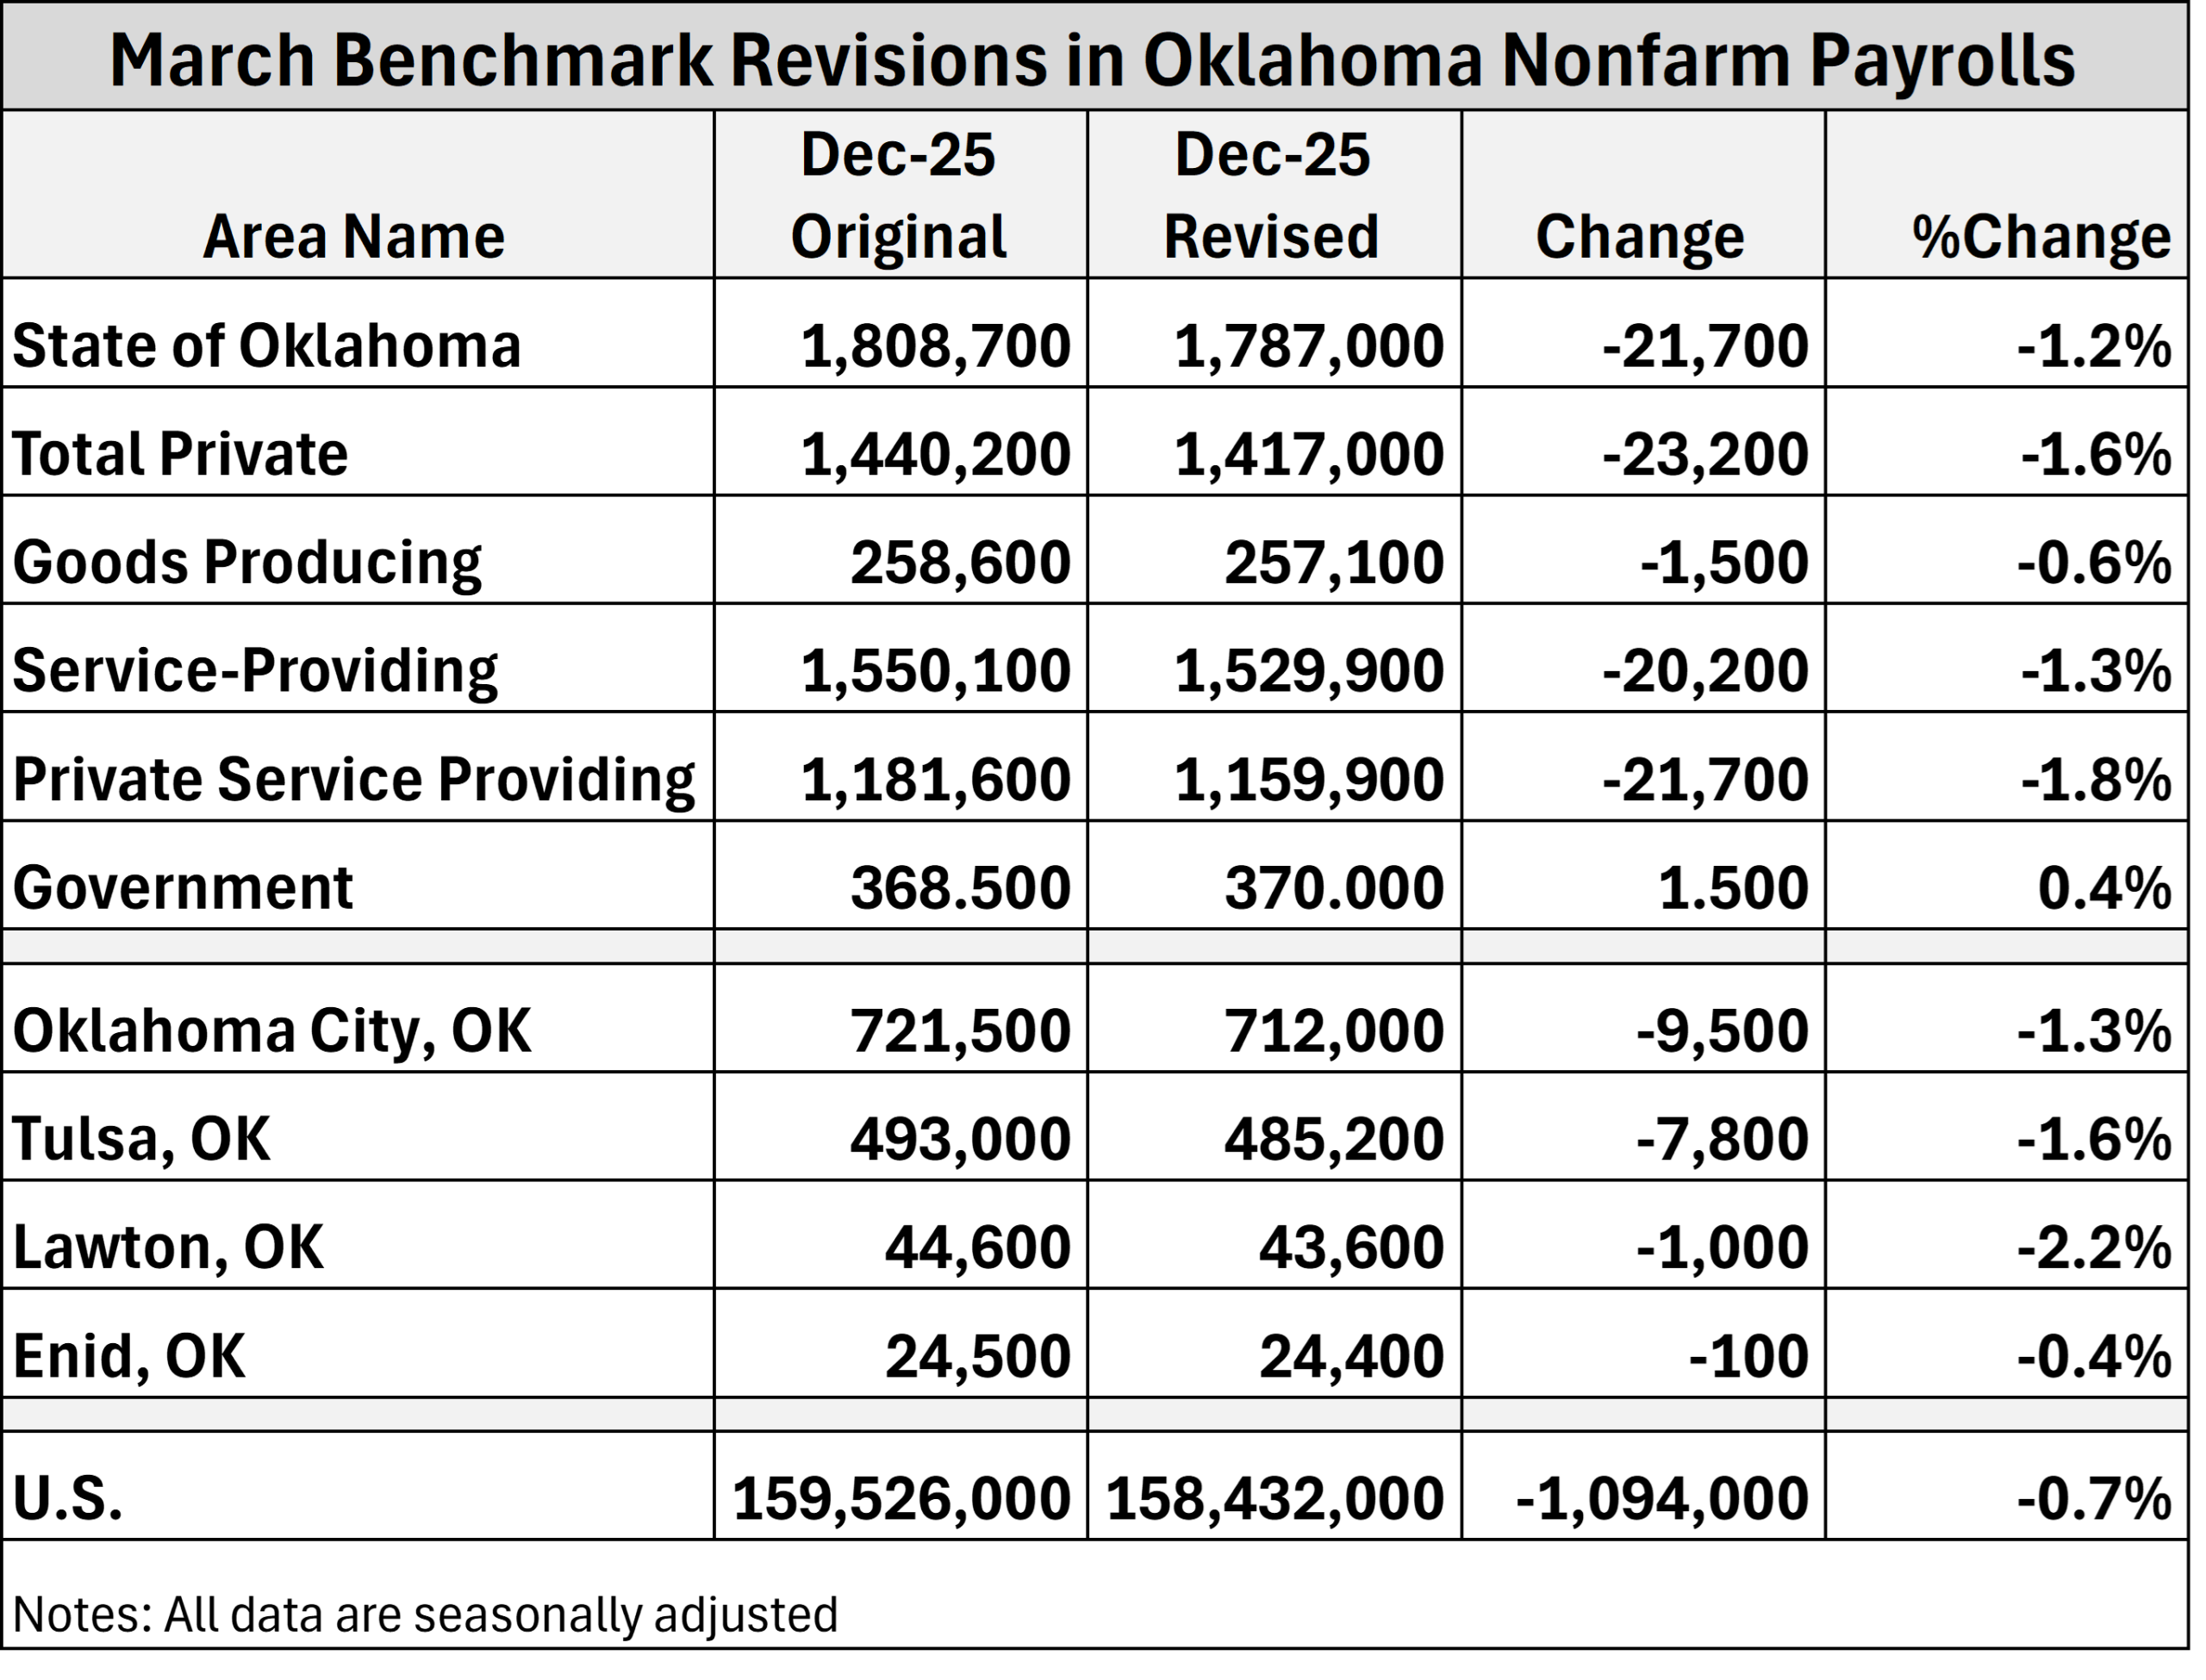
I haven't seen much discussion about the downward revisions to Oklahoma job data released earlier this month. We knew some weakness was coming, but the…
Graphic: Fiscal and Monetary Policy View of the U.S. Economy (1960-2012)
Timeline of Economic Policy & Activity (1960-2012) Â [pdf]
An outstanding economist, Kate Watkins, at the Federal Reserve Bank of Kansas City shared with me a graphic that is particularly helpful in understanding the long-run patterns and interactions between economic activity and policy decisions in the U.S..
Related Posts