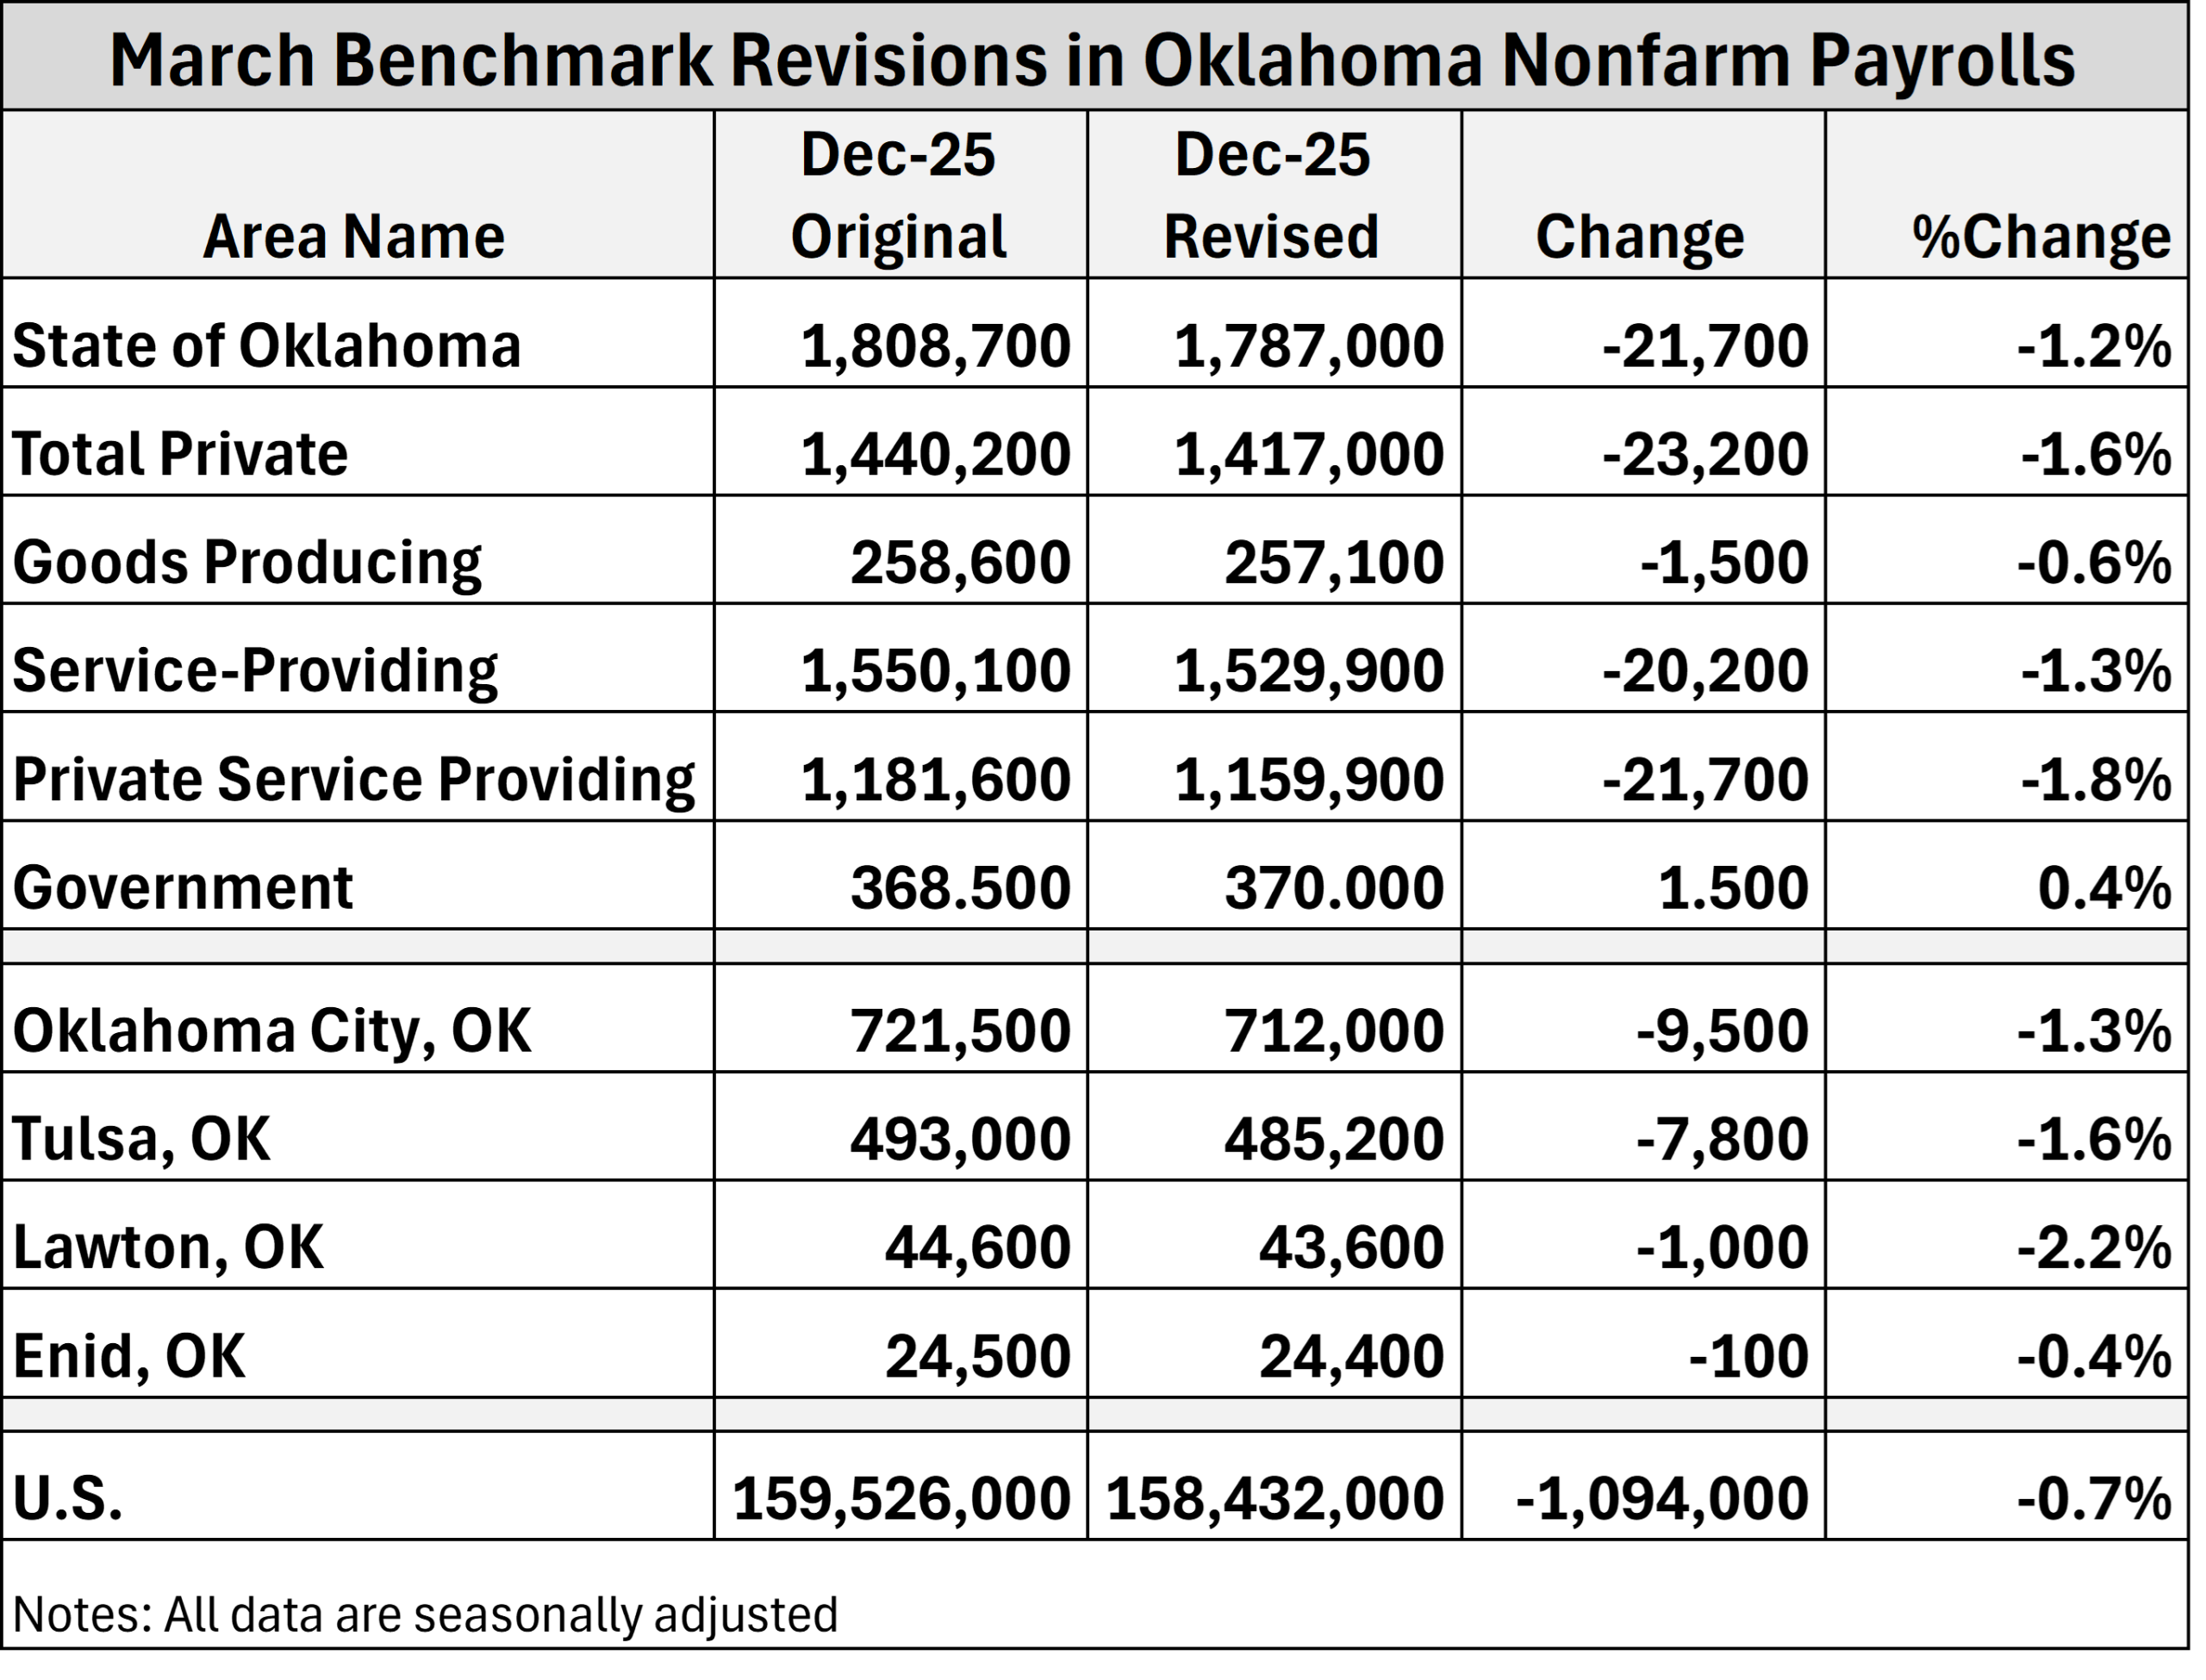
I haven't seen much discussion about the downward revisions to Oklahoma job data released earlier this month. We knew some weakness was coming, but the…
Small Differences in Education Drive Large Income Gaps Among States
Yes, those states with the highest education levels do tend to have the highest average incomes. In fact, the relationship is remarkably strong and consistent across the 50 states. Our pic-of-the-week shows the relationship between per capita income and the average number of years of schooling across the states in 2013. As you might suspect, the traditional high income (e.g. MA, CT, MN, CO, NJ, MD) and low income (e.g. WV, MS, AR, KY, AL) states generally have education levels to match.
The underlying moral of the story is that the payoff to increasing the level of education in a state can be substantial. The simple linear model shown suggests that an extra year of schooling across a state’s labor force adds $12,897 to per capita income at the state level. Just one year of education. That’s the difference between those states near the bottom and those near the top. (Yes, this is an oversimplified model and other factors matter, but you get the idea just how important education is.)
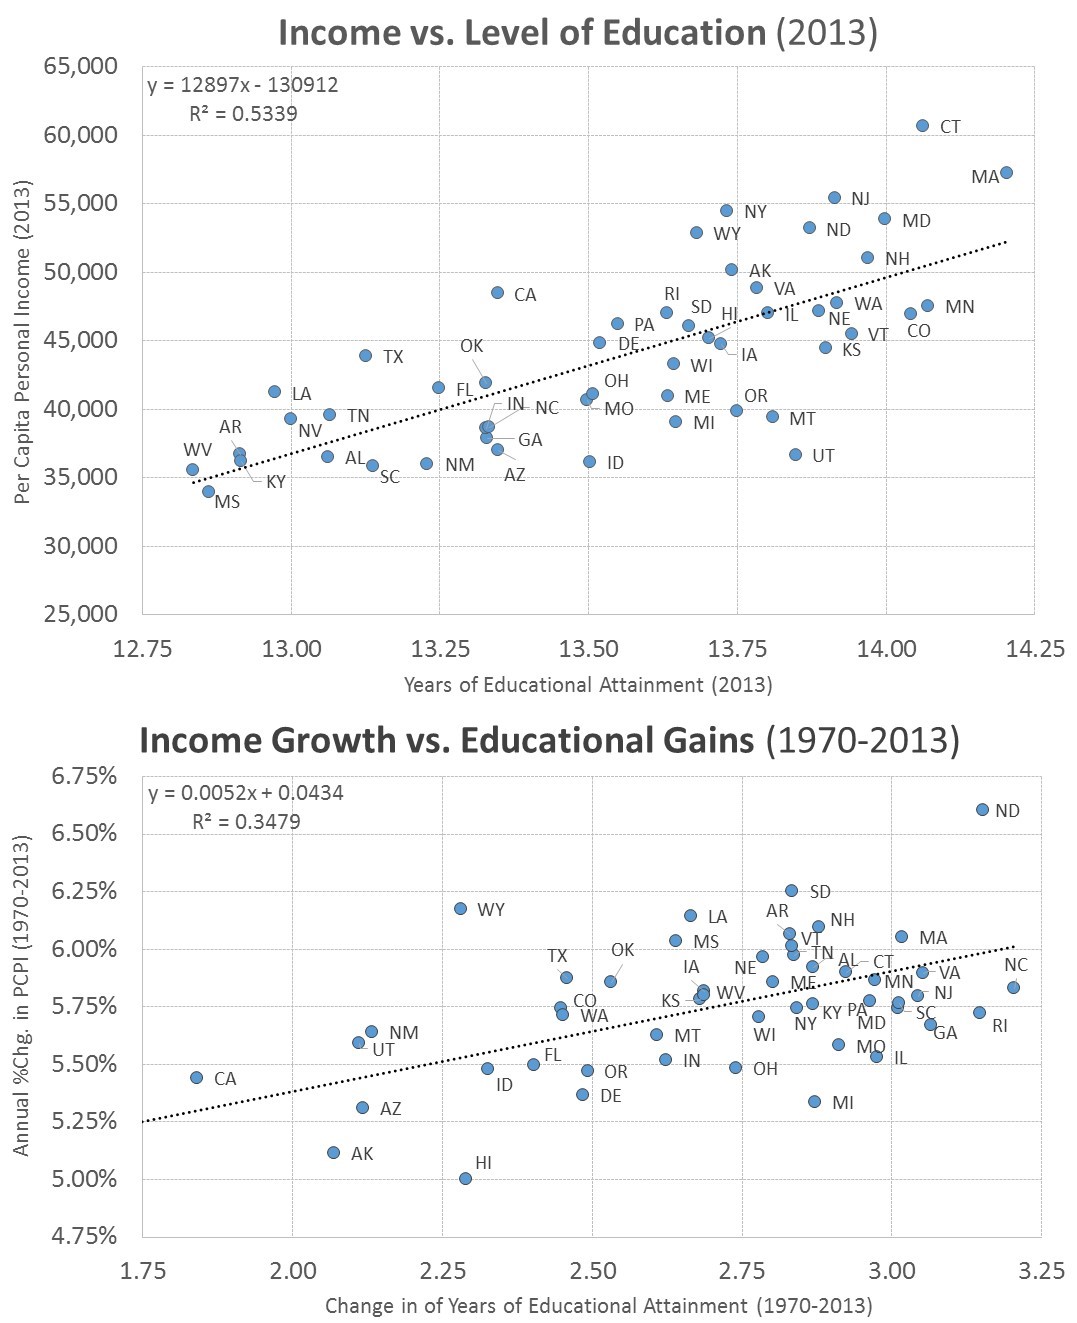
The problem is that it is not easy to make up one year against the field. Statewide education gains come only slowly. In the more than 40 year period from 1970 to 2013, most states increased their average years of education by only about 2.0 to 3.0 years.
The bottom panel shows the change in years of educational attainment from 1970 to 2013 relative to average annual growth in per capita personal income for the 50 states in the same period. Again, the relation is strong and consistent across the states. Those states with the greatest education gains generally had the fastest income gains in the period.
The estimated linear model suggests that an extra year of educational attainment over the period produced an additional 0.52% in annual per capita income growth in the period. Relatively large education gains explains how many of the traditional low-income states (e.g. SC, WV, AR, TN) produced some of the largest income gains since 1970. Modest education gains also explain why some of the areas we generally think of as growth regions (e.g. CA, UT, AZ, FL, OR) rank in the bottom half of the pack in income gains since 1970.
You will also notice that many of the oil and gas states (e.g. WY, TX, OK, LA) managed to post very high income growth despite posting education gains that rank only in the lower half of the states. That is the power of being an energy state. However, North Dakota is clearly an exception. It managed to post the highest income gain in the period and the second highest increase in years of schooling. Education gains and energy explain why it is such an all-around outlier above.
Sign up to receive RegionTrack’s PIC OF THE WEEK!
[email_link]
Related Posts