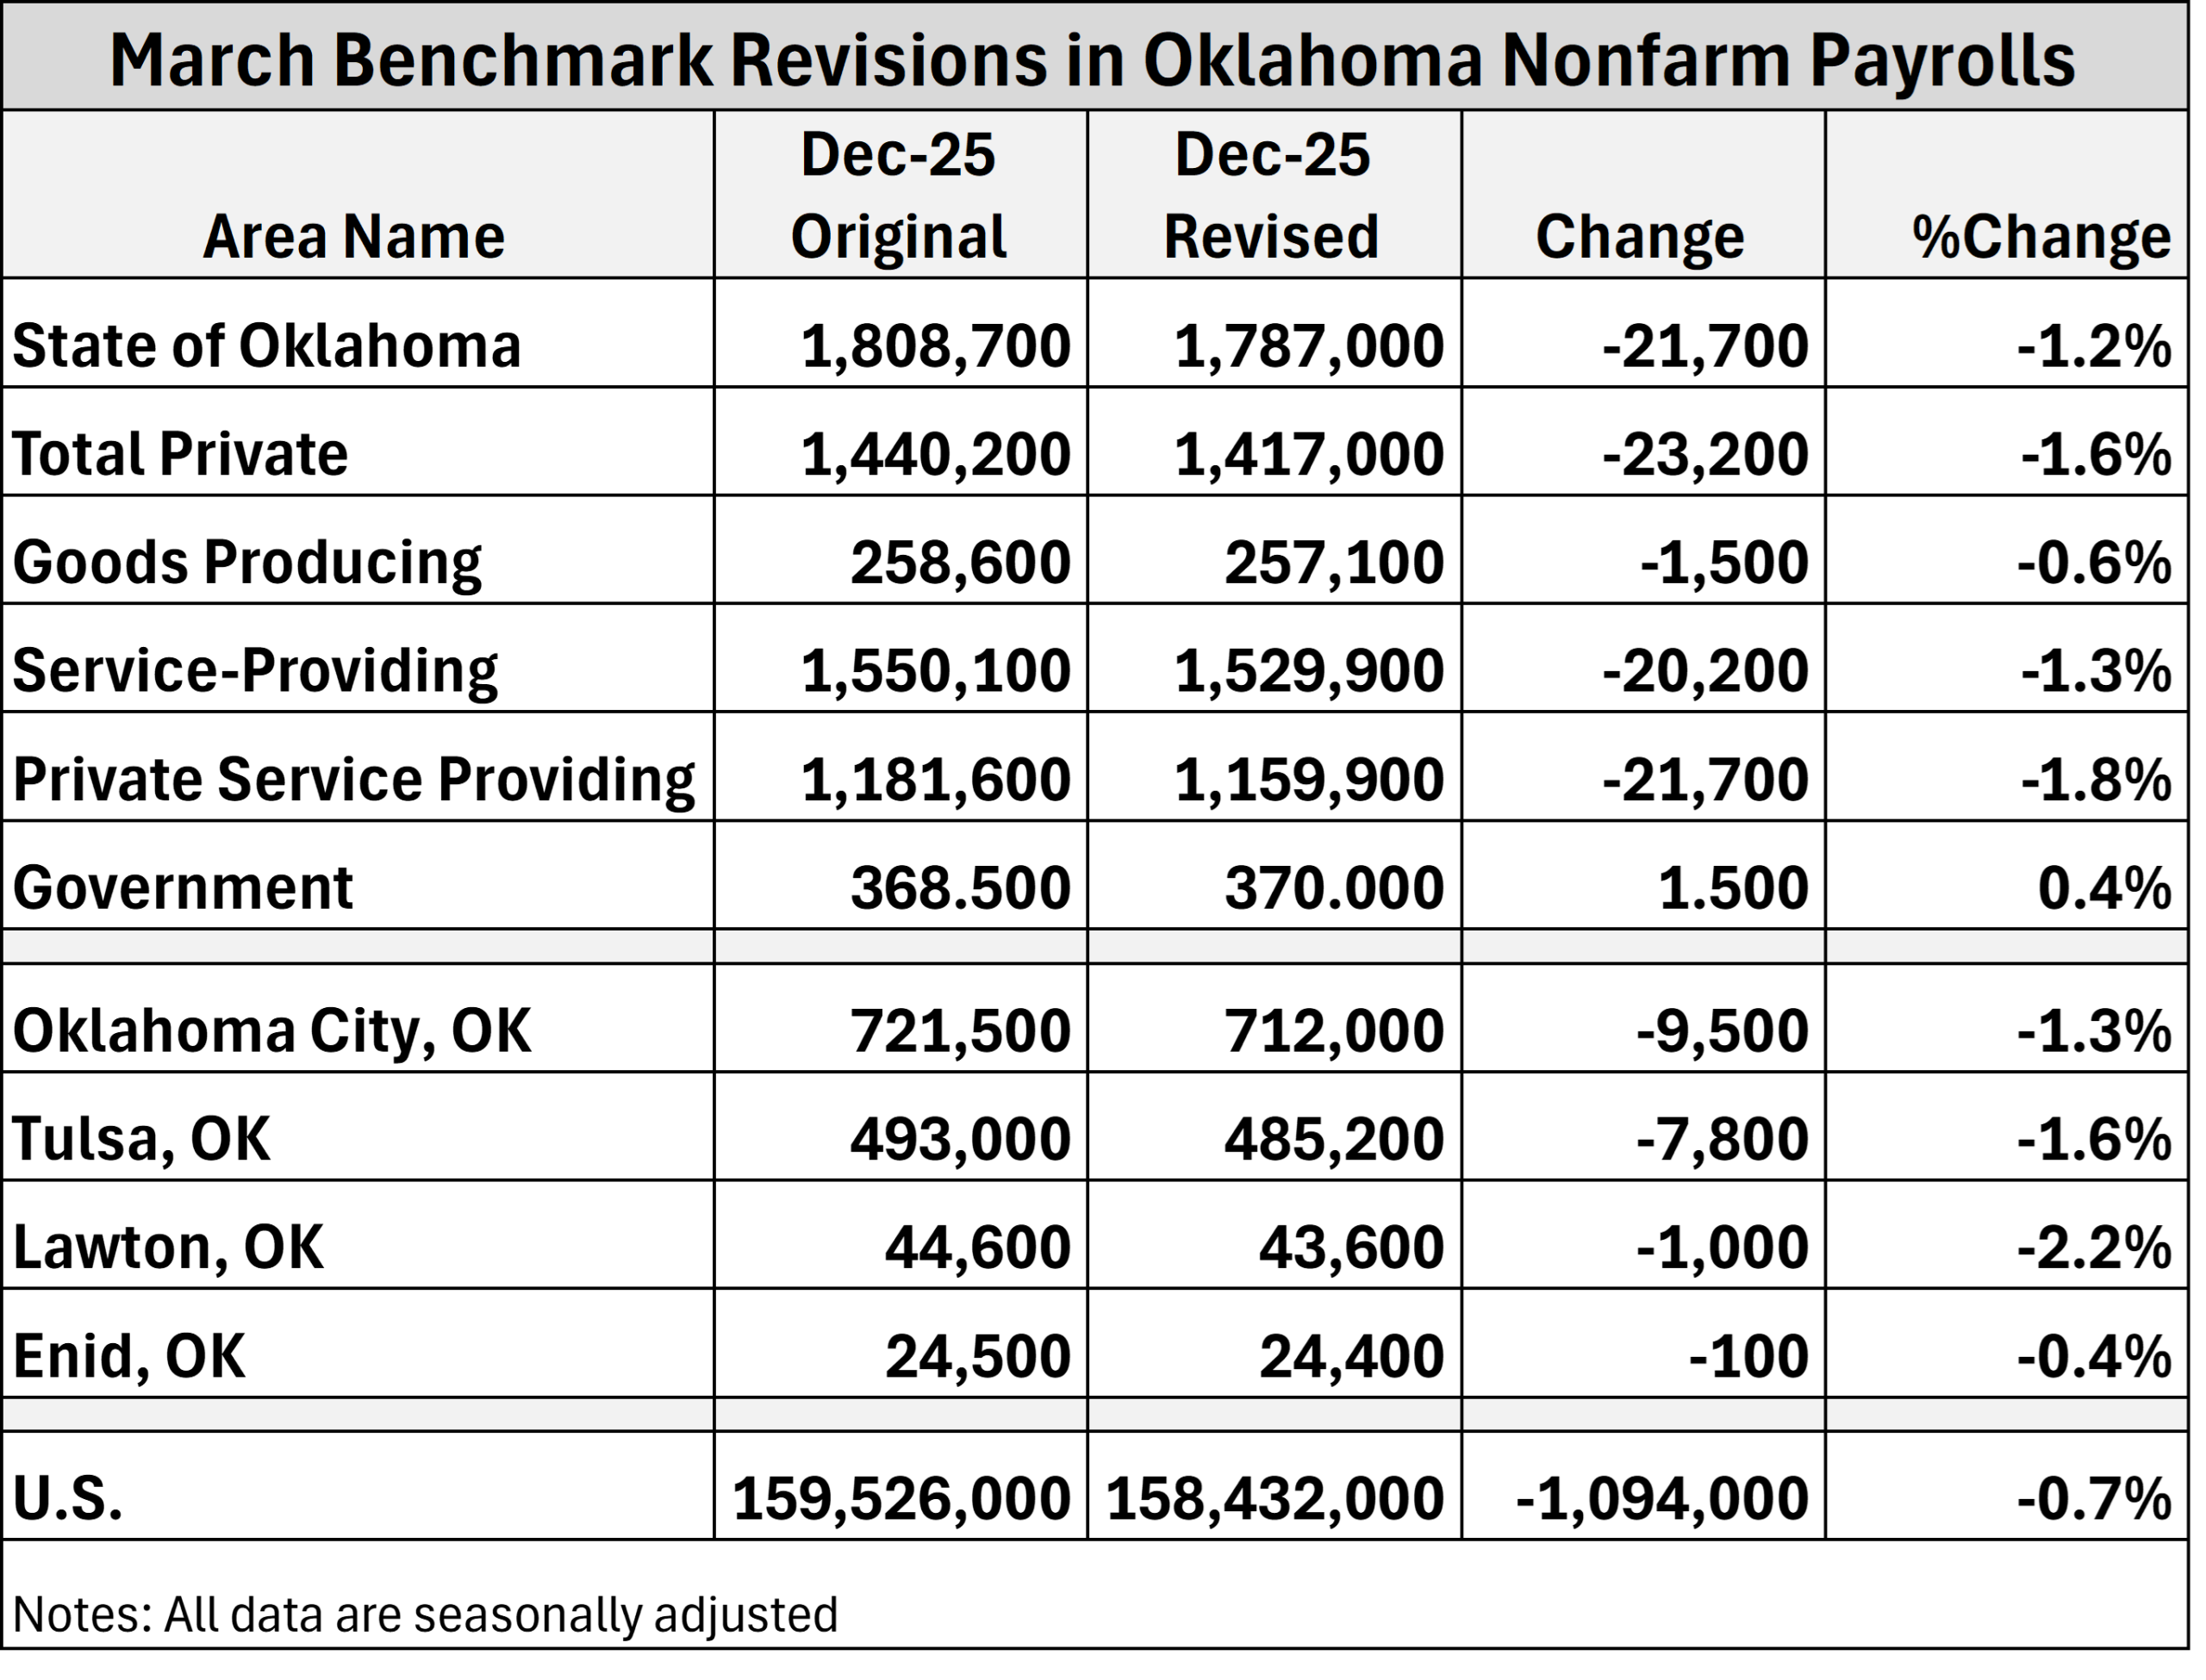
I haven't seen much discussion about the downward revisions to Oklahoma job data released earlier this month. We knew some weakness was coming, but the…
Which States Use the Most Paid Child Care?
There is surprisingly little data on the topic. We provided an answer to this question in completing a recent project on child care at the state level for the Committee for Economic Development (ced.org). What did we find?
At the state level, enrollment in paid care varies from a low of 15.9 percent in both Utah and West Virginia to a high of 37.2 percent in North Dakota. Thirty states have a share of children in paid care between 20 percent and 28 percent, a fairly narrow range extending roughly 4 percentage points above and below the 23.8 percent national share. Ten states have a share below 20 percent, while ten have a share above 28 percent.

The five states with the lowest rates of paid care include Utah (15.9 percent), West Virginia (15.9 percent), New Mexico (17.0 percent), Arizona (18.5 percent), and Hawaii (18.8 percent). Other states use a significantly higher share of paid care, often at more than twice the rate of the lowest usage states.
The highest overall usage rates are found in North Dakota (37.2 percent), South Dakota (36.9 percent), Nebraska (36.2 percent), Minnesota (35.8 percent), Vermont (34.0 percent), and Iowa (32.0 percent). Most of these states are located in the upper Midwest and generally have much-higher-than-average usage rates for both preschool and school-age children.
The table below details estimates of the share of children ages 14 and under in paid child care in each state, including a breakout of the totals for both preschool and school-age children.
Usage rates for preschool children ages 4 and under are the most variable across the states. While the national share of preschool children in paid care is 31.4 percent, state rates range from a low of 8.1 percent in Maine (only about one in twelve) to a high of 51.1 percent in North Dakota (one of every two).
For the 20.5 percent of school-age children (ages 5 to 14) in paid care nationally in the CPS survey, usage rates fall within a much narrower range, from a low of 14.1 percent in Maine to a high of 30.8 percent in South Dakota.
| Children Ages 14 and Under in Paid Child Care by State | |||||||||
| Region | Total Children of Child Care Age | Children In Paid Child Care | Share in Paid Child Care | ||||||
| Total | Ages 0-4 | Ages 5-14 | Total | Ages 0-4 | Ages 5-14 | Total | Ages 0-4 | Ages 5-14 | |
| United States | 61,089,123 | 19,868,088 | 41,221,035 | 13,857,336 | 5,954,524 | 8,028,735 | 23.8% | 31.4% | 20.5% |
| Alabama | 921,016 | 297,104 | 623,912 | 185,677 | 76,285 | 110,535 | 20.2% | 25.7% | 17.7% |
| Alaska | 157,878 | 55,392 | 102,486 | 37,489 | 15,344 | 22,534 | 23.7% | 27.7% | 22.0% |
| Arizona | 1,347,565 | 431,758 | 915,807 | 249,556 | 106,246 | 146,332 | 18.5% | 24.6% | 16.0% |
| Arkansas | 591,324 | 192,916 | 398,408 | 116,426 | 53,130 | 62,971 | 19.7% | 27.5% | 15.8% |
| California | 7,598,091 | 2,507,536 | 5,090,555 | 1,523,458 | 610,783 | 922,476 | 20.1% | 24.4% | 18.1% |
| Colorado | 1,038,870 | 335,136 | 703,734 | 250,923 | 108,820 | 145,429 | 24.2% | 32.5% | 20.7% |
| Connecticut | 639,273 | 191,937 | 447,336 | 170,047 | 68,518 | 102,216 | 26.6% | 35.7% | 22.8% |
| Delaware | 170,244 | 56,319 | 113,925 | 37,465 | 15,820 | 21,916 | 22.0% | 28.1% | 19.2% |
| Dist. of Columbia | 96,084 | 40,967 | 55,117 | 30,450 | 15,388 | 15,332 | 31.7% | 37.6% | 27.8% |
| Florida | 3,324,369 | 1,078,313 | 2,246,056 | 721,768 | 304,708 | 428,820 | 21.7% | 28.3% | 19.1% |
| Georgia | 2,077,631 | 668,508 | 1,409,123 | 451,323 | 198,336 | 259,786 | 21.7% | 29.7% | 18.4% |
| Hawaii | 259,190 | 90,770 | 168,420 | 48,630 | 21,181 | 27,865 | 18.8% | 23.3% | 16.5% |
| Idaho | 357,803 | 113,487 | 244,316 | 71,097 | 26,705 | 44,503 | 19.9% | 23.5% | 18.2% |
| Illinois | 2,499,834 | 799,019 | 1,700,815 | 554,269 | 239,002 | 319,761 | 22.2% | 29.9% | 18.8% |
| Indiana | 1,315,506 | 420,815 | 894,691 | 281,341 | 118,225 | 166,397 | 21.4% | 28.1% | 18.6% |
| Iowa | 602,101 | 194,726 | 407,375 | 192,930 | 83,130 | 110,189 | 32.0% | 42.7% | 27.0% |
| Kansas | 605,708 | 200,406 | 405,302 | 157,306 | 72,164 | 85,763 | 26.0% | 36.0% | 21.2% |
| Kentucky | 844,643 | 274,874 | 569,769 | 168,460 | 74,013 | 94,586 | 19.9% | 26.9% | 16.6% |
| Louisiana | 930,829 | 308,217 | 622,612 | 203,991 | 102,672 | 103,721 | 21.9% | 33.3% | 16.7% |
| Maine | 213,002 | 65,014 | 147,988 | 59,400 | 24,002 | 35,263 | 27.9% | 36.9% | 23.8% |
| Maryland | 1,115,466 | 367,210 | 748,256 | 327,634 | 135,398 | 195,274 | 29.4% | 36.9% | 26.1% |
| Massachusetts | 1,144,025 | 365,546 | 778,479 | 309,114 | 142,587 | 169,136 | 27.0% | 39.0% | 21.7% |
| Michigan | 1,838,782 | 572,768 | 1,266,014 | 428,273 | 177,996 | 255,327 | 23.3% | 31.1% | 20.2% |
| Minnesota | 1,066,261 | 347,567 | 718,694 | 381,357 | 163,198 | 217,894 | 35.8% | 47.0% | 30.3% |
| Mississippi | 614,976 | 198,426 | 416,550 | 138,660 | 61,738 | 78,332 | 22.5% | 31.1% | 18.8% |
| Missouri | 1,160,974 | 376,837 | 784,137 | 308,687 | 139,097 | 173,266 | 26.6% | 36.9% | 22.1% |
| Montana | 186,272 | 61,272 | 125,000 | 41,899 | 18,559 | 23,671 | 22.5% | 30.3% | 18.9% |
| Nebraska | 390,469 | 130,160 | 260,309 | 141,170 | 61,661 | 79,208 | 36.2% | 47.4% | 30.4% |
| Nevada | 550,411 | 178,194 | 372,217 | 108,350 | 45,083 | 62,921 | 19.7% | 25.3% | 16.9% |
| New Hampshire | 219,370 | 65,661 | 153,709 | 55,870 | 23,569 | 32,488 | 25.5% | 35.9% | 21.1% |
| New Jersey | 1,666,413 | 533,235 | 1,133,178 | 358,559 | 156,257 | 208,212 | 21.5% | 29.3% | 18.4% |
| New Mexico | 424,415 | 138,724 | 285,691 | 72,319 | 32,030 | 41,744 | 17.0% | 23.1% | 14.6% |
| New York | 3,502,059 | 1,173,627 | 2,328,432 | 675,163 | 318,838 | 368,047 | 19.3% | 27.2% | 15.8% |
| North Carolina | 1,907,861 | 612,295 | 1,295,566 | 449,998 | 201,593 | 255,942 | 23.6% | 32.9% | 19.8% |
| North Dakota | 136,970 | 48,767 | 88,203 | 50,935 | 24,942 | 26,493 | 37.2% | 51.1% | 30.0% |
| Ohio | 2,185,335 | 690,821 | 1,494,514 | 543,521 | 224,995 | 322,809 | 24.9% | 32.6% | 21.6% |
| Oklahoma | 794,571 | 264,479 | 530,092 | 164,800 | 71,494 | 93,997 | 20.7% | 27.0% | 17.7% |
| Oregon | 710,576 | 230,022 | 480,554 | 200,885 | 76,181 | 125,987 | 28.3% | 33.1% | 26.2% |
| Pennsylvania | 2,234,011 | 715,904 | 1,518,107 | 520,530 | 219,799 | 306,286 | 23.3% | 30.7% | 20.2% |
| Rhode Island | 175,066 | 54,632 | 120,434 | 44,411 | 16,344 | 28,366 | 25.4% | 29.9% | 23.6% |
| South Carolina | 901,182 | 292,316 | 608,866 | 183,658 | 83,337 | 100,957 | 20.4% | 28.5% | 16.6% |
| South Dakota | 174,688 | 59,957 | 114,731 | 64,387 | 29,104 | 35,336 | 36.9% | 48.5% | 30.8% |
| Tennessee | 1,240,428 | 399,677 | 840,751 | 262,424 | 120,050 | 143,918 | 21.2% | 30.0% | 17.1% |
| Texas | 5,900,424 | 1,940,825 | 3,959,599 | 1,220,505 | 529,341 | 702,745 | 20.7% | 27.3% | 17.7% |
| Utah | 759,465 | 253,867 | 505,598 | 120,690 | 42,445 | 78,304 | 15.9% | 16.7% | 15.5% |
| Vermont | 99,777 | 30,478 | 69,299 | 33,970 | 14,581 | 19,571 | 34.0% | 47.8% | 28.2% |
| Virginia | 1,555,039 | 512,115 | 1,042,924 | 402,039 | 172,491 | 232,949 | 25.9% | 33.7% | 22.3% |
| Washington | 1,328,817 | 444,620 | 884,197 | 352,085 | 142,509 | 210,677 | 26.5% | 32.1% | 23.8% |
| West Virginia | 316,000 | 102,194 | 213,806 | 50,351 | 20,222 | 30,162 | 15.9% | 19.8% | 14.1% |
| Wisconsin | 1,082,722 | 344,331 | 738,391 | 302,780 | 141,665 | 164,969 | 28.0% | 41.1% | 22.3% |
| Wyoming | 115,337 | 38,347 | 76,990 | 30,307 | 12,953 | 17,353 | 26.3% | 33.8% | 22.5% |
|
Source: U.S. Census Bureau, Current Population Survey – March Supplement (2010-2014).
Notes: State shares are estimated using the percentage of children ages 0-4 and 5-14 reported as participating in paid child care in the Current Population Survey based on a five-year average share in the 2010-2014 period. |
|||||||||
Related Posts