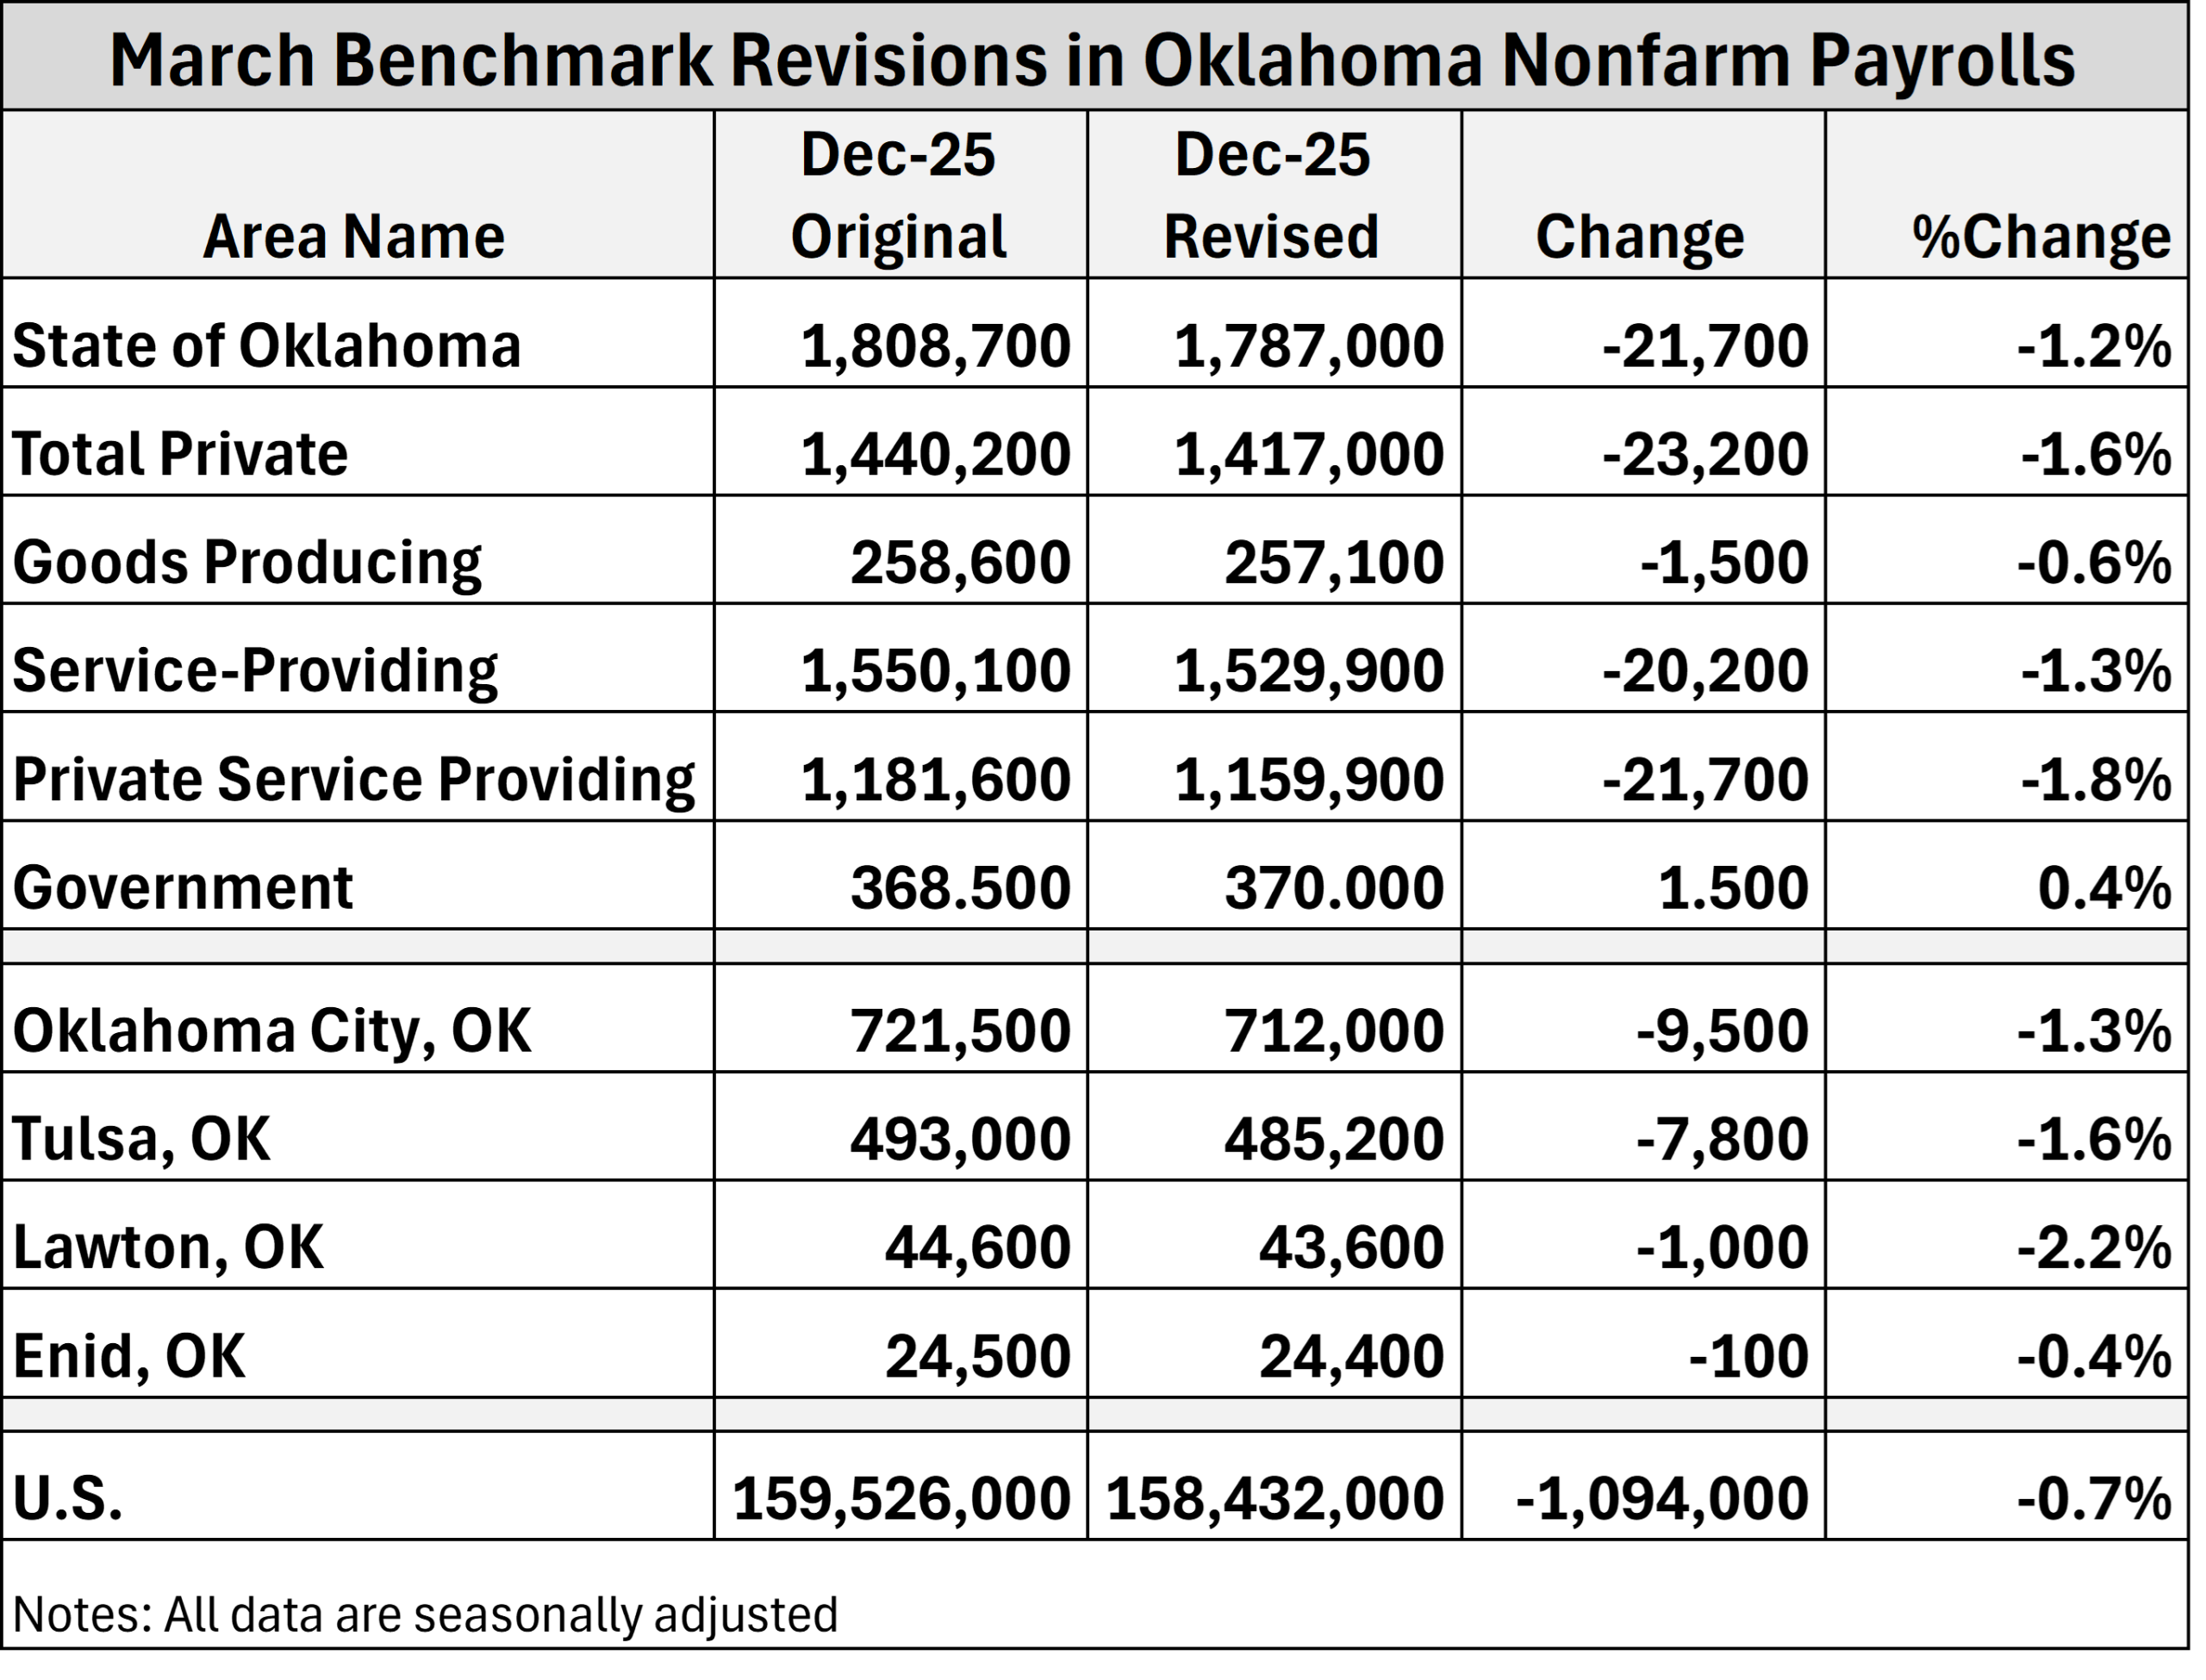
I haven't seen much discussion about the downward revisions to Oklahoma job data released earlier this month. We knew some weakness was coming, but the…
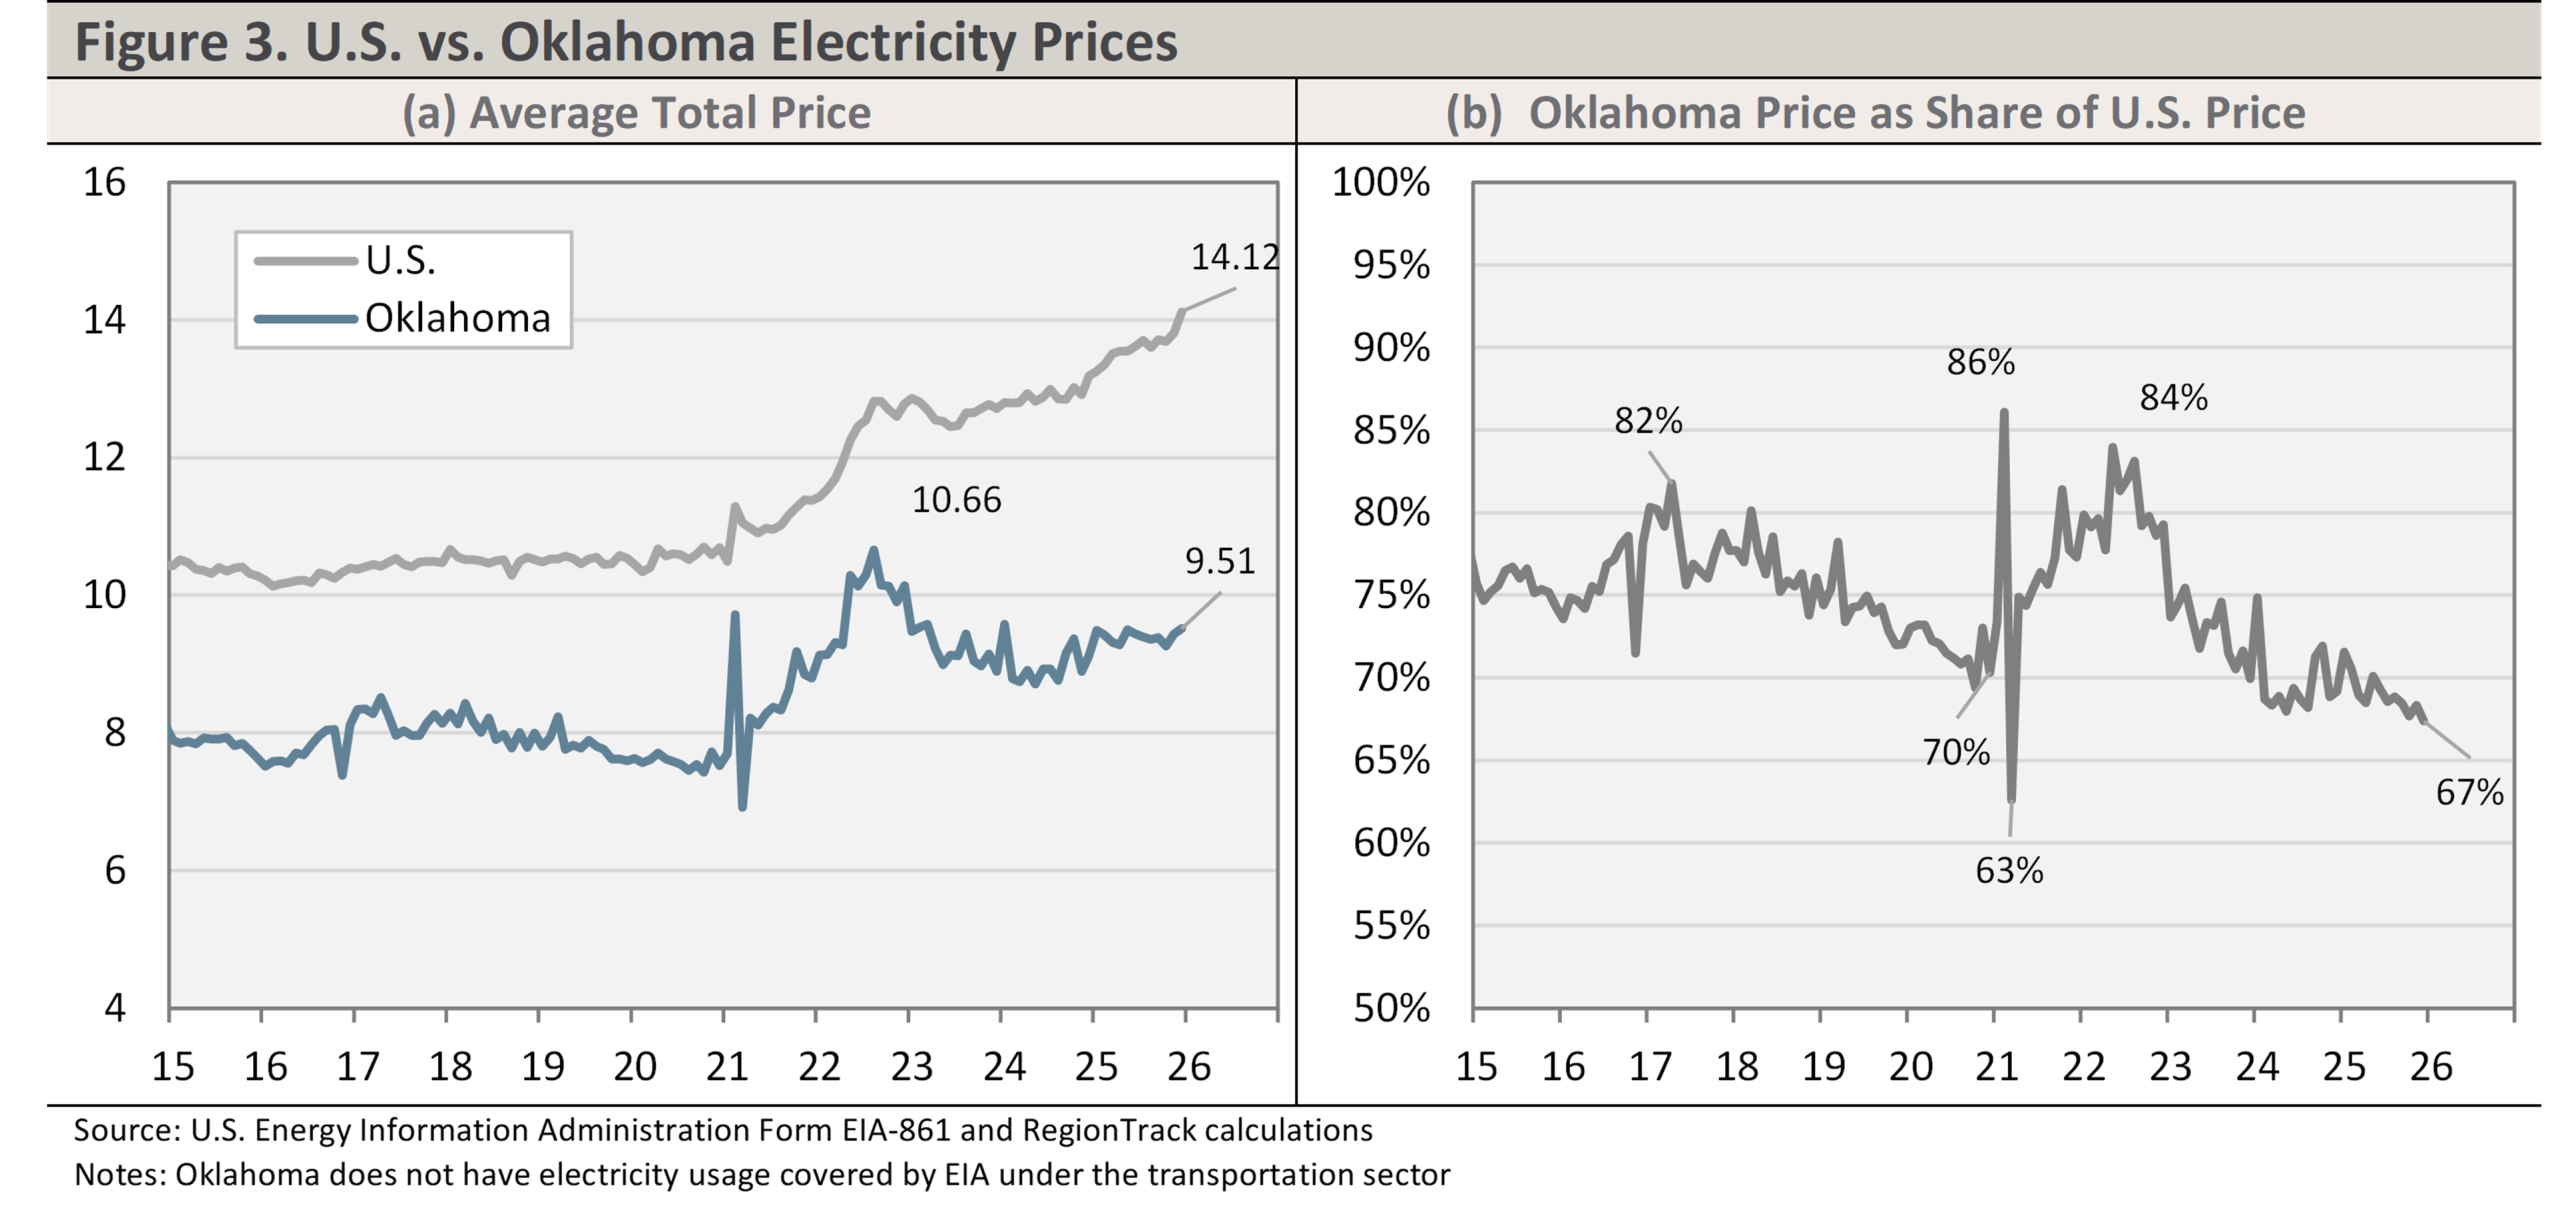
Growing Oil and Gas Supply Contains Energy Costs for Oklahoma Consumers
Prior to the recent surge in oil and gas production, U.S. energy consumers were facing all-time high prices for petroleum-based products and natural gas. EIA forecasts continued to suggest that energy prices would likely climb even higher going forward. Instead, high prices provided a strong incentive to the domestic energy industry to find new oil and gas reserves, and the resulting surge in production is history.
The tremendous increase in domestic crude oil and natural gas output that followed has now put sharp downward pressure on market prices for both fuels. Possibly the greatest benefit to the state of the resurgence in oil and gas activity in recent years is the reduced cost of energy. While this is now working against the state’s energy firms, it is providing significant cost savings to state households and firms.
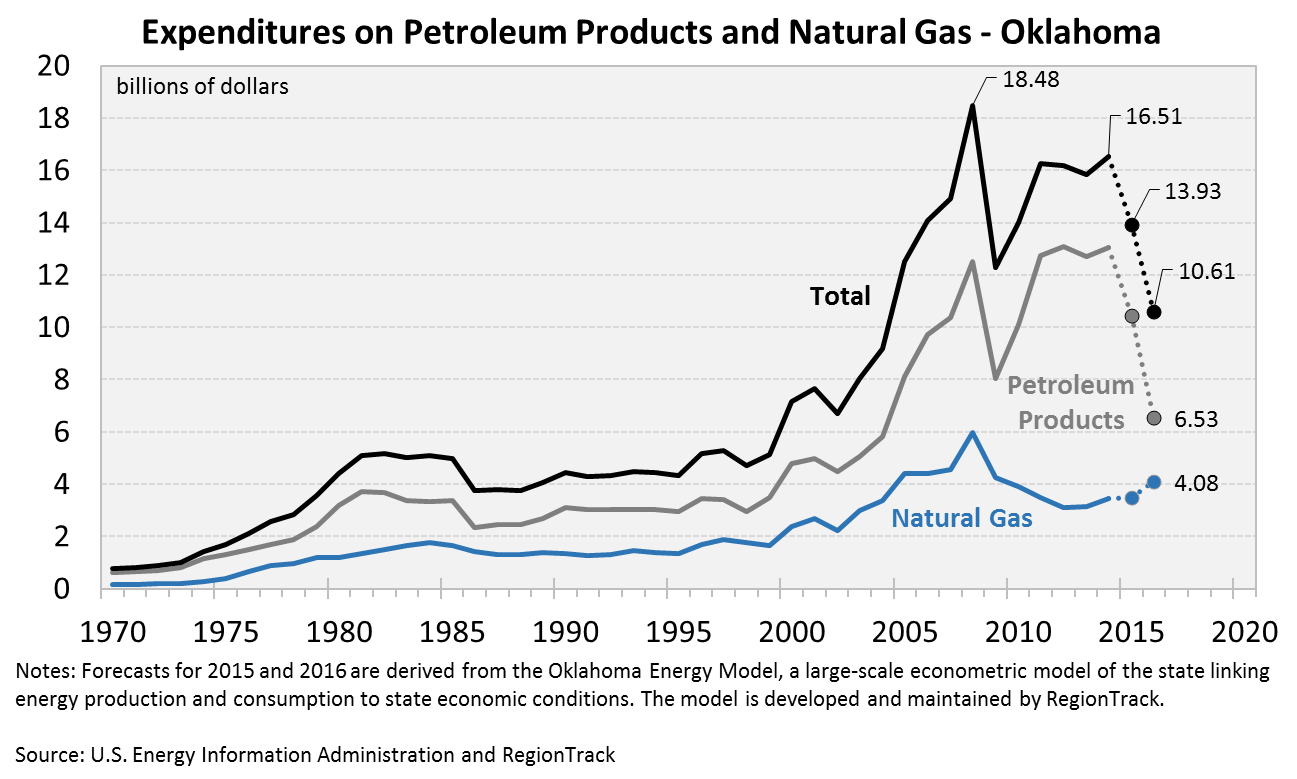 The above figure details total expenditures on petroleum products and natural gas in Oklahoma annually since 1970. On the natural gas side, expenditures doubled between 2001 and 2008 to $6 billion annually as natural gas prices appeared to be on a steadily rising trend. Rising U.S. natural gas production finally tipped the price balance in 2009 and started a sustained drop in both natural gas prices and expenditures in the state. The volume of natural gas consumption in the state peaked in 2008 and has since declined by about 8%. However, total state expenditures on natural gas have dropped by nearly half to the $3.0 to $3.5 billion range in the 2012 to 2014 period. Model-based estimates suggest that natural gas expenditures will rebound to about $4 billion annually in 2015 and 2016 driven by a rebound in natural gas prices.
Estimates of the gross cost savings to state natural gas consumers from the pullback in natural gas prices since 2009 can be formed. For example, had natural gas prices leveled off in the range seen in the 2006 to 2008 period and stayed there through 2015, state natural gas expenditures would have been roughly $10.1 billion higher on a cumulative basis between 2009 and 2015. In other words, the supply-induced drop in the price of natural gas saved state purchasers nearly $1.5 billion annually since 2009. In contrast, EIA forecasts at the time suggested flat natural gas expenditures going forward at the national level.
Natural gas savings will accrue largely to industrial, commercial, and residential users. Assuming the estimated $1.5 billion in annual natural gas savings are allocated relative to usage, savings would total $811 million annually for industrial users, $245 million for commercial users, and $440 million for residential users. Total residential savings on natural gas represent an average of $260 per year for each of the 1.7 million housing units in the state.
The same historical pattern of a run-up in price that drives added production is present on the oil side. Oil prices crossed $50 per barrel for the first time in late 2004. Prices then moved upward to an average of $81 per barrel over a ten-year period between late 2004 and late 2014. Petroleum expenditures in Oklahoma more than doubled from $5.8 billion in 2004 to more than $13 billion in 2014.
Elevated oil prices ultimately led to a remarkable increase in domestic drilling activity that began to push up domestic production in 2010 and eventually halt a 40-year decline in U.S. oil production. Much as it did on the natural gas side, the rebound in U.S. oil production eventually led to a collapse in oil prices in late 2014. State consumers are now enjoying similar cost savings on petroleum products. Oil prices dropped from more than $100 per barrel in late 2014 to below $30 in early 2016. Prices have since moved up to the $40 to $50 range, roughly half the level prior to the collapse. Estimates in Figure 30 suggest that petroleum expenditures in Oklahoma fell to $10.4 billion in 2015 and will fall further to only $6.5 billion in 2016.
The savings on petroleum products realized by state consumers in coming years could potentially far exceed the savings on natural gas. Between 2008 and 2014, state petroleum expenditures averaged $11.7 billion annually. In 2015 and 2016 alone, state petroleum expenditures are estimated to be a cumulative $6.5 billion lower than the average expenditures realized from 2008 to 2014. This suggests an annual savings of $3.25 billion annually for state consumers in 2015 and 2016. Again, EIA forecasts from 2010 suggested continued elevated crude oil prices and little relief in total expenditures on petroleum products.
Petroleum savings will accrue primarily to transportation and industrial users. Assuming the estimated $3.25 billion in annual petroleum savings are allocated relative to usage, savings would total $2.8 billion for transportation users and $335 million for industrial users in the state in both 2015 and 2016. For transportation users, the savings is equivalent to 5.9 cents for each of the 47.7 billion vehicle miles traveled in Oklahoma in 2014.[i]Â Based on an average driver who logs almost 13,500 miles per year, the savings on petroleum is an estimated $790 per year.[ii] [i] Vehicle miles traveled by state are available online at: https://www.fhwa.dot.gov/policyinformation/statistics/2014/vm2.cfm
[ii] Miles driven annually by age group and sex are available online at: https://www.fhwa.dot.gov/ohim/onh00/bar8.htmSee the full report at: “Economic Impact of the Oil and Gas Industry on the Oklahoma Economy.” Sep. 2016. Prepared for the State Chamber of Oklahoma Research Foundation by RegionTrack, Inc.
Related Posts